

The gold market has experienced a dramatic and highly volatile journey through the first half of 2026. After surging to historic, record-breaking highs above $5,600 per troy ounce in January, the precious metal entered an aggressive correction phase. Over the second quarter, hawkish central bank rhetoric, easing geopolitical frictions, and a resilient US dollar triggered what became gold’s worst quarterly performance in over a decade.
However, as we step fully into July 2026, the relentless selling pressure has finally hit a roadblock. A wave of weaker-than-expected economic data out of the United States has forced macro investors to rethink their timelines, allowing gold to firmly establish a near-term bottom. This article provides a comprehensive breakdown of today’s gold prices alongside a deep dive into the technical and fundamental analysis shaping the weekly outlook.
1. Today’s Gold Price Update (July 6, 2026)
As of today, Monday, July 6, 2026, spot gold is trading across global desks around $4,150 to $4,176 per troy ounce. In early market action, the metal dipped slightly by about 0.47% to find support near the $4,150.56 threshold, consolidation behavior that follows a major relief rally staged at the end of last week.
Despite the minor intra-day dip, broader sentiment surrounding the metal has taken a noticeably optimistic turn. Taking a step back to look at the broader timeline, today’s prices reflect a modest 3.85% decline over the past month, but they retain a commanding 24.38% increase compared to the same period last year.
Regional Spotlights and Physical Markets
The stabilization in global spot prices has created ripple effects across localized physical gold markets:
- Asian Markets (Vietnam): Domestically, SJC gold bar prices are holding firm at an elevated anchor level. Major operators such as the Phu Quy Jewelry Group and DOJI Group have listed buying and selling thresholds around 148.4 to 151.4 million VND/tael. The regional spread between buying and selling continues to hover at a wide 3 to 3.5 million VND/tael, indicating that while underlying demand remains, local retailers are pricing in heightened short-term volatility.
- Indian Retail Markets: Across major Indian metros like New Delhi, Mumbai, and Chennai, retail jewelry rates have plateaued following a brief upward correction over the weekend. Premium 22-karat gold jewelry is currently trading between Rs 13,450 and Rs 13,485 per gram across tier-one showrooms like Tanishq and Malabar Gold. Local dealers note that while the sharp price drop below $4,000 last week brought an influx of physical retail buyers out of hiding, the subsequent bounce toward $4,170 has caused consumer appetite to soften slightly once again.
2. Weekly Fundamental Analysis: The Catalysts Shifting the Narrative
To understand why gold has suddenly found its footing after a brutal multi-month downtrend, one has to look directly at the macroeconomic indicators released over the past few days.
The June Nonfarm Payrolls Shock
The single most powerful catalyst reversing gold’s downward trajectory was the explosive US Nonfarm Payrolls (NFP) report released at the tail end of last week. Going into the release, market consensus forecasted a healthy addition of roughly 110,000 jobs to the US economy. Instead, the data printed an incredibly weak 57,000 jobs added for June—marking the smallest monthly gain in four months. Concurrently, the US unemployment rate ticked up to 4.2%.
Because gold is a non-yielding asset, its primary adversary is high interest rates, which raise the opportunity cost of holding bullion. Prior to the NFP report, hawkish expectations had driven traders to price in a high probability of a September interest rate hike by the Federal Reserve. Following the dismal jobs data, the CME FedWatch tool showed the implied probability of a September rate hike plunging from a dominant 66% down to a coin-flip 50%. The sudden reality of a cooling labor market instantly capped the aggressive bets of macro bears, prompting swift short-covering across commodities desks.
Easing Energy and Inflationary Pressures
Another dynamic throwing a lifeline to gold is the shifting energy complex. Shipping routes and commercial traffic through the crucial Strait of Hormuz have continued to show steady recovery amid diplomatic progress in US-Iran negotiations. The stabilization of maritime energy flows, coupled with a projected supply increase from OPEC+ members, has cooled global crude oil prices significantly.
Lower oil prices act as a cooling agent for headline inflation. With inflation expectations moderating, central bankers are facing less immediate pressure to aggressively tighten monetary policy. This easing macro anxiety was heavily underscored by recent commentary from Fed figures like Kevin Warsh, who reaffirmed a commitment to stability while noting that broader inflationary pressures are moving into a more manageable range.
Central Bank Buying Under the Microscope
While institutional investor flows via Western Exchange-Traded Funds (ETFs) saw net outflows of roughly 38 tonnes toward the end of June, central banks are quietly maintaining an accumulation bias. Data provided by the World Gold Council indicated that central banks added a net 41 metric tons of gold to global sovereign reserves during May.

While on-the-books buying from massive institutional players like Türkiye saw a temporary cooling in the first quarter, over-the-counter (OTC) data and Swiss refinery flows reveal that under-the-radar sovereign accumulation is still incredibly healthy. Nations like China have continued a steady diversification program away from Western fiat currencies, structurally backstopping gold even during its deepest quarterly liquidations.
3. Technical Analysis: Breaking the Bearish Structure
From a purely technical charting perspective, the weekly perspective suggests that gold has transitioned away from a structural “one-way sell-off” and entered a definitive testing phase.
Key Gold Price Technical Levels
| Price Level (USD/oz) | Technical Classification / Description |
| $4,300 | Major Resistance / 200-Day Moving Average (MA) |
| $4,170 | Immediate Resistance / 20-Day Moving Average (MA) |
| $3,980 | Recent Multi-Month Floor |
| $3,880 | Major Structural Support |
The 20-Day Moving Average Breakthrough
For the past two months, gold’s price action was entirely governed by its 20-day moving average (DMA). Throughout the entire second-quarter correction, this technical line acted as an absolute ceiling, capping every single attempt at a relief bounce.
That structural barrier finally cracked last week. Propelled by the NFP data, spot gold surged to reclaim its 20-DMA, posting a 2% weekly gain and snapping a painful four-week consecutive losing streak. Reclaiming this short-term moving average does not mean a long-term bull market has resumed, but it formally confirms that the immediate bearish momentum has stalled.
Key Levels to Watch This Week
- Immediate Support ($3,980 – $4,100): Last week’s multi-month low near $3,980 has officially been established as a definitive near-term floor. For the bulls to remain in control of this correction, any pullback early this week must hold above the psychological $4,100 zone. If gold falls back through this level, a retest of the $3,880 structural support becomes highly likely.
- Immediate Resistance ($4,170 – $4,300): Gold is currently battling overhead supply around the $4,170 level. If macro buyers can gather enough momentum to close a daily candle above $4,170, the door swings wide open for a technical run toward $4,300, where the highly significant 200-day moving average currently resides.
4. Weekly Outlook and Institutional Forecasts
Looking ahead at the remainder of the week, gold is expected to trade within a volatile, news-driven range. Investors will continue to closely monitor the fallout from US employment metrics, updates on US-Iran trade channels, and weekly ETF flow data to gauge whether institutional money is ready to flip from sellers back to sustained buyers.
While short-term technical analysts note that the recent “Death Cross” (where the 50-DMA crossed below the 200-DMA) still casts a shadow over the medium-term chart, major global investment banks remain structurally bullish for the long haul. Major institutions have adjusted their timelines slightly due to the Federal Reserve’s sticky interest rate policies, but the macro destination remains high. Top-tier firms like J.P. Morgan Global Research maintain a year-end target projecting gold to push back up toward $5,000 per troy ounce by the final quarter of 2026, driven by a broader, long-term cooling of global economic growth.
Summary Checklist for Traders
- Today’s Pivot: Reclaiming and defending $4,150 is crucial for daily stability.
- Weekly Bull Case: A clean break past $4,170 opens an extended run to the $4,300 resistance block.
- Weekly Bear Case: A macro reversal that pushes gold back under $4,100 exposes the structural floor at $3,980.
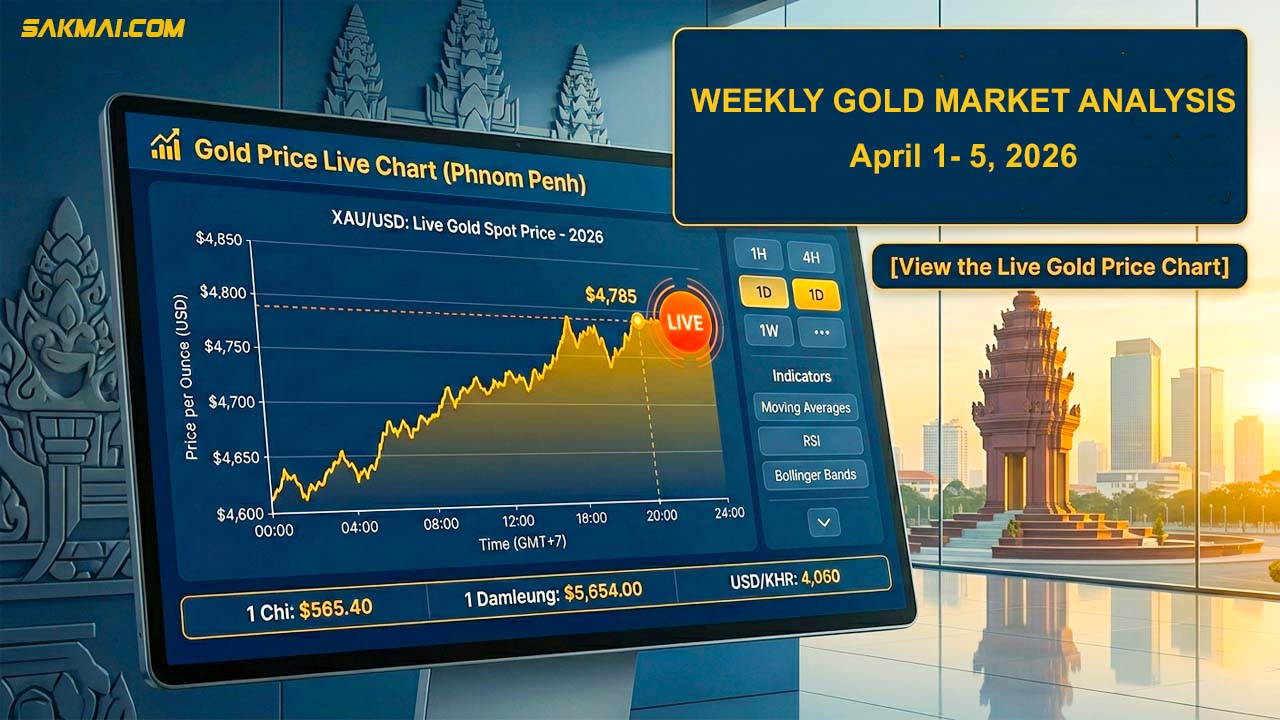
If you want to watch Global Gold Price Live chart, Please Visit here
Frequently Asked Questions (FAQ)
1. Why did gold prices recover after hitting a recent low?
The primary catalyst for gold’s recent recovery was the weak U.S. Nonfarm Payrolls (NFP) report released in early July 2026. The U.S. economy added only 57,000 jobs in June—far below market expectations—while the unemployment rate ticked up to 4.2%. This cooling labor market reduced expectations for aggressive Federal Reserve interest rate hikes, stopping the bearish momentum and prompting investors to buy back into gold as a safe-haven asset.
2. How do interest rates directly affect the price of spot gold?
Gold is a non-yielding asset, meaning it does not pay interest or dividends to investors who hold it. When interest rates are high or rising, the opportunity cost of holding gold increases because investors can earn guaranteed returns elsewhere (such as in government bonds). Conversely, when economic data signals that interest rates might flatten or cut, gold becomes highly attractive, driving its price upward.
3. What are the key support and resistance levels for gold this week?
For the current week, the immediate technical levels to watch are:
- Immediate Resistance: $4,170 per troy ounce. A clean daily close above this level opens a path toward $4,300 (the 200-day moving average).
- Immediate Support: $4,100 per troy ounce. If gold breaks below this level, it is highly likely to retest its recent multi-month psychological floor near $3,980.
4. Are central banks still purchasing gold in 2026?
Yes, central banks maintain a strong structural bias toward gold accumulation. According to data from the World Gold Council, global institutions added a net 41 metric tons of gold to sovereign reserves in May alone. Many developing nations continue to steadily diversify their financial reserves away from Western fiat currencies and into physical bullion, which serves as a long-term floor for global prices.
5. What is the long-term price forecast for gold through the end of 2026?
While short-to-medium-term charts show volatility due to shifting central bank policies, major institutional firms remain structurally bullish for the long haul. Leading global research divisions, including J.P. Morgan, maintain long-term targets forecasting that gold could push back up toward $5,000 per troy ounce by the fourth quarter of 2026 as global economic growth naturally cools.

![[LIVE] Cambodia Daily Gold Price & Market Report – March 1, 2026 _1](https://sakmai.com/wp-content/uploads/2026/03/LIVE-Cambodia-Daily-Gold-Price-Market-Report-–-March-1-2026-_1-1.jpg)
![[LIVE] Cambodia Daily Gold Price & Market Report – March 1, 2026 _1](https://sakmai.com/wp-content/uploads/2026/03/LIVE-Cambodia-Daily-Gold-Price-Market-Report-–-March-1-2026-_1.jpg)